The first part of this lecture was an introduction to Lean Principles with a review of the History of Lean, and the 5 Principles of the Lean Production System.
Now, let’s switch gears and review the 8 Major Lean Tools which are meant to achieve the 5 core lean principles:
- The 8 Deadly Wastes (Muda)
- 5S
- The Value Stream Map
- Kanban
- Visual Control
- Standard Work
- Takt Time
- Single Minute Exchange of Die (SMED)
Tool 1: The 8 Wastes (Muda) in Lean
Perhaps the biggest miss-conception about lean is that lean is all about Waste. This is not true, lean is about value, but waste is the opposite of value, which is why many lean practitioners focus heavily on the identification and elimination of waste.
As lean originated in Japan as part of the Toyota Production System, waste is commonly called by its original Japanese name, Muda. Muda (Waste) is defined as any activity that consumes resources but creates no value for the customer.
Taiichi Ohno defined the 7 Deadly wastes in his work with Toyota, and since then an 8th waste has been added, the waste of non-utilized talent. To remember the 8 forms of waste All you have to do is remember DOWNTIME.
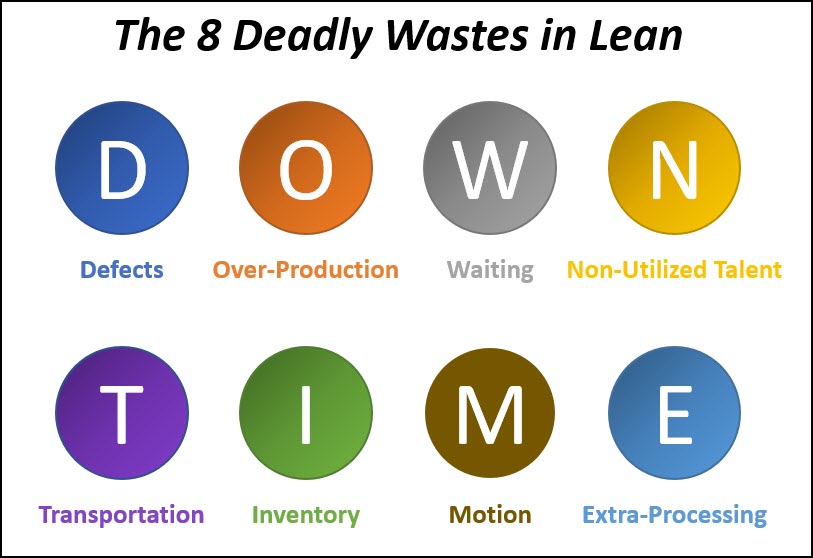
Waste #1: Defects
Products that don’t meet the customers needs or function as intended are clearly a form a waste. Building a unit that doesn’t meet specification is clearly a waste of your time, effort, resources and material.
Similarly, products that require rework because they were not produced correctly the first time are a form of waste. Tools like Poka-yoke, Jidoka, standard work and root cause analysis can be used to reduce or eliminate defects.
Waste #2: Over-Production
Over-production is defined as the production of material before it is needed.
Over-production is often considered the worst form of waste because it leads to other forms of waste including inventory, motion, transportation, etc.
The waste of over-production is often remedied by a pull system like a Kanban that ensures value only flows at the pull of the customer (Takt Time), or a SMED project to reduce setup times to allow for small batch sizes (or single piece flow).
Waste #3: Waiting
The waste of waiting occurs when production assets are forced to wait due to poor flow or any other issues within the value stream.
Anytime a resource must wait due to an unbalanced or out-of-sync process, the production flow is interrupted and the waste of waiting occurs resulting in lost productivity and the inability to meet the customer demand.
Using standardized work can improve the consistency of flow and time are achieved for each step to reduce the waste of waiting. SMED projects can also be used to improve change-over times and reduce the waste of waiting.
Waste #4: Non-Utilized Talent
An organizations biggest resource is its human resource.
When people’s talents go under-utilized, the organizations biggest asset goes under-utilized.
This is the newest and 8th form of waste, which is the waste of non-utilized talent. This goes back to the concept of lean being fundamentally a people process.
This form of waste is to address through the engagement of all associates in continuous improvement and the development of people through skill building and training.
Waste #5: Transportation
Remember, value is something that a customer is willing to pay for. When we think about things like transportation from that perspective it’s easy to see why transportation is a form of waste.
Customers don’t care that you need to move material from one side of the country to another, or from one warehouse to another, or from one side of your production floor to another.
This is why the unnecessary transportation of materials is considered waste – because the customers are not interested in paying for it.
Certainly, some transportation will always be necessary, but any unnecessary transportation is simply waste.
The tool of value stream mapping can highlight the waste of transportation, and the placement of equipment and manufacturing locations near each other can eliminate the waste of transportation.
Waste #6: Inventory
The waste of inventory is any material that are not needed to support the immediate production need of meeting the demand of the customer.
Similar to transportation, customers don’t care about inventory – especially inventory that’s not needed to fill a customer need. This could include inventory of raw materials, supplies or finished goods.
Inventory always requires extra space, extra transportation and extra effort to manage which is why having any unnecessary amounts of inventory is wasteful.
Kanban systems are often used to control inventories and ensure they are appropriately sized.
Waste #7: Motion
Transportation is the waste associated with the unnecessary movement of materials. The human analogy to this is the waste of motion which is the unnecessary movement of people that does not add any value.
Excess motion can also increase the risk of a safety issue for employees if they’re required to travel unnecessary distances, lift heavy objects, bend awkwardly reach to far or repeat motions unnecessarily. Making this waste even nastier.
Tools like 5S can ensure that your work-place is organized to eliminate unnecessary motion.
Also, a spaghetti diagram can be used to explore the motion within a production process to identify excess motion, and allow for the re-arrangement of a production process of improved flow.
Waste #8: Extra-Processing
Extra-processing, also commonly called over-processing is the waste that occurs when you put in more effort, time or work into a production step than what is needed.
This might include grinding, polishing and painting a component that your customer would simply be okay just grinding. This might also look like a 200% visual inspection because your process isn’t capable of reliably producing good parts.
Tool 2: 5S
While waste is often the #1 focus of lean practitioners, 5S is often the most utilized tool within Lean.
5S is a workplace organization tool meant to organize, clean and standardize a workplace.
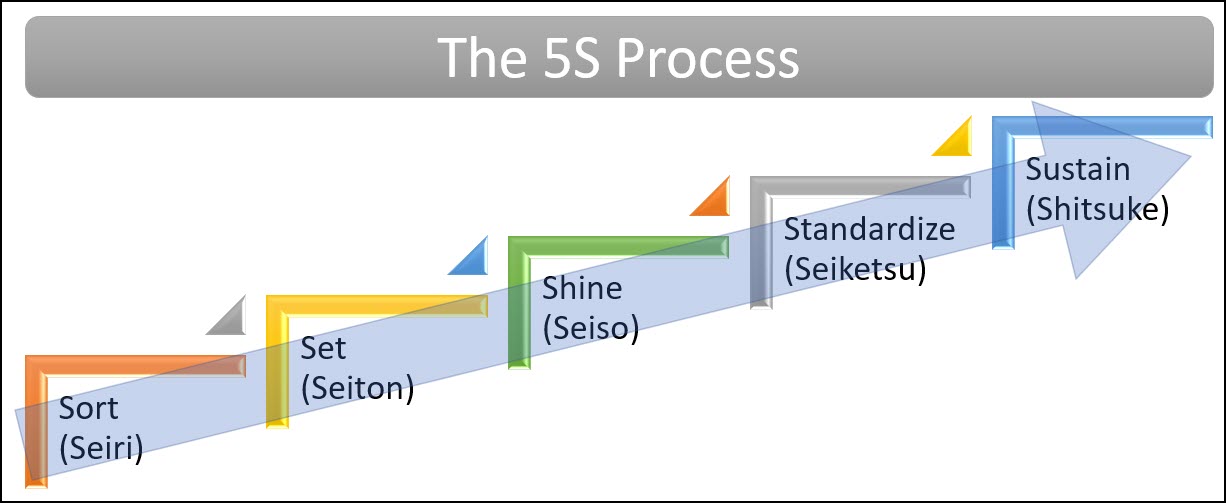
There are 5 S’s within 5S, which define the 5-step process to the 5S tool, these include:
- Seiri (Sort) – Eliminate that which is not needed
- Seiton (Set) – Organize the remaining Items near point of use for ease of use
- Seiso (Shine) – Clean and inspect the work area
- Seiketsu (Standardize) – Create standards for previous 3 steps to ensure daily activity
- Shitsuke (Sustain) – Regularly apply the 5S standards above
Having an organized workplace is often the first step in identifying and eliminating many of the 8 deadly wastes – particularly motion, waiting and transportation.
In addition to making waste visible, 5S results in an organized, uncluttered, safe work environment.
In fact, 5S has proven itself as such a useful tool to improve safety that 5S is often called 6S with the last S being a focus on safety.
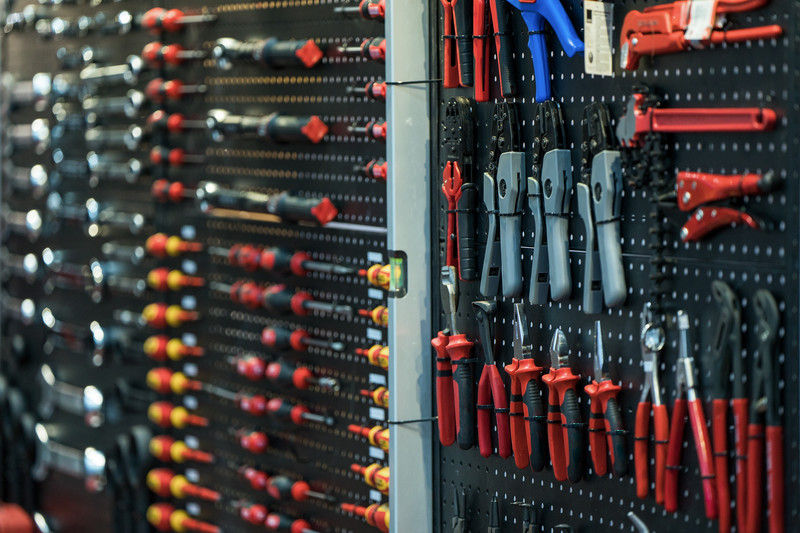
5S is a great example of a visual control tool. Many 5S practitioners will utilize shadow boards, signal, floor tape and other tools to standardize the work and sustain the 5S program.
Tool 3: The Value Stream Map (VSM)
What is a Value Stream Map?
A Value Stream Map (VSM) is a unique type of process flow diagram used to visually map the entire value stream of a product from start to finish.
The VSM is a lean tool to document, analyze, communicate, and improve the end-to-end value stream associated with a product or service.
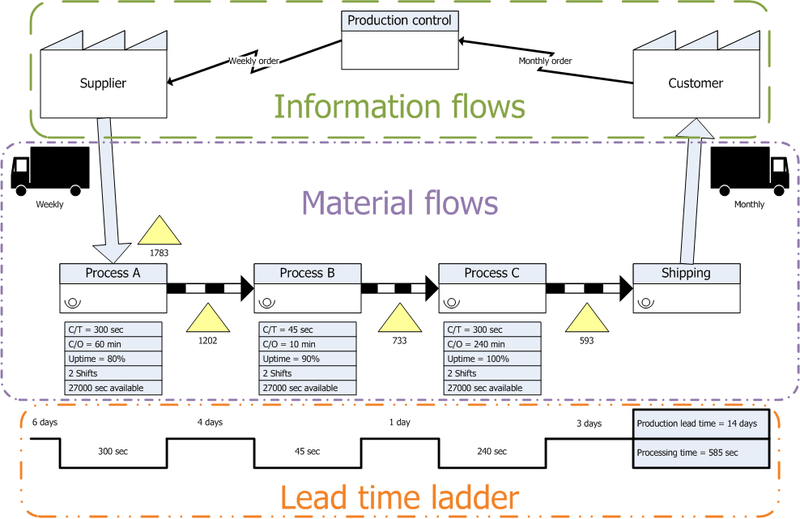
Below is an example of a value stream showing material traveling from the supplier, through the manufacturing process all the way to the distribution to the customer.
Creating a Value Stream Map
A value stream should not only convey the flow of value, but should also include the flow of information, data about each step in the process and inventory levels throughout the process.
Value Stream Maps are often created as part of the initial phase of a Kaizen Blitz in order to get alignment of the Value Stream and identify opportunities for rapid improvement.
Also, going to the GEMBA is an important part of creating an accurate VSM. Oftentimes there are important differences between how a process Is believed to be occurring, and how it’s actually occurring.
A VSM should be created by a cross-functional team of subject matter experts who know the process best. This should often include the front-line folks who execute the process on a day-to-day basis.
The VSM can be used to document the current state, but can also be used to map out the future state of the value stream.
Analysis of a Value Stream Map
Analysis of the current state should be conducted to identify waste, or opportunities to improve flow. The value stream can also be used to identify bottlenecks in the production process.
The analysis of a value stream can also identify the necessary inventory levels needed to support the process. This can lead to a right-sized kanban system between upstream and downstream processes, or with vendors of raw material.
Analysis of a value stream should also focus on identifying unnecessary or non-value added steps in the process.
A non-value added activity is any activity that consumes resources but adds no value to the product or service.
Some activities are non-value added but required, such as an inspection of product. These activities cannot be easily eliminated.
Tool 4: Kanban
During the development of the Toyota Production System, Toyota engineers like Taiichi Ohno visited the U.S. and visited a supermarket, which was the inspiration for the modern day kanban.
Ohno noticed that the supermarkets were able to keep their shelves stocked by replenishing empty locations with inventory from the back of the supermarket, and then only re-ordering material that has been consumed.
This was able to keep the shelves stocked while also keeping inventory low and the food on the shelf fresh.
Ohno and others wanted to emulate this approach within Toyota to ensure they only produced items that were consumed by downstream items.
To accomplish this, Ohno created kanban to indicate when a “shelf” in the supermarket is empty as a sign to the upstream process to produce the needed item.
The word Kanban (pronounced kahn-bahn) translates into English as a signboard or signal, and it is used to communicate the need to start or stop producing an item.
The Kanban is used to create a pull system to ensure production only occurs at the pull of the customer.
The method of a kanban ensures material is only produced when it’s needed and thus limits inventory and ensure that value is pulled through a system instead of pushed.
Kanbans are always facilitated by a visual signal – this is often a cart, bin or kanban card which all serve to communicate that production of a particular item must occur.
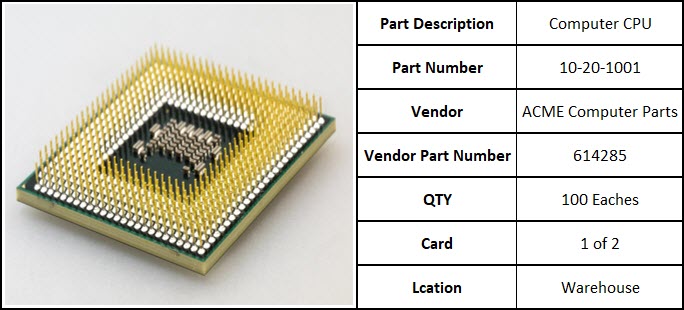
Additionally, because a kanban system limits inventory, if there are any issues that interrupt the flow of material, these issues will be quickly identified as opportunities for improvement (kaizen).
As processes are improved, kanban inventory levels can be reduced to further eliminate waste in order to achieve single piece flow.
This leads us to our next lean tool, which is that of visual control.
Tool 5: Visual Control
Visual controls, indicators or displays used throughout many typical lean manufacturing operations which are meant to facilitate communication and also make it easier to identify abnormalities in the process.
Visual Control makes problems visible, and problems become opportunities for improvement.
Production boards are an example of a visual control where key metrics are tracked on a daily, weekly or even an hourly basis to determine if a production process is operating appropriately.
This might include safety metrics, quality metrics, productivity metrics, equipment metrics (downtime, uptime, availability, etc), or standard work metrics.
5S is a form of visual control where the location of tools, inventory and equipment is often specified using signage, tape or shadow boards.
Tool 6: Standard Work
Taiichi Ohno once said – “Without standard Work, there is no kaizen (good changes)”.
Standard work is a living document that represents the best, safety, most effective and efficient method for conducting an activity or executing a process.
Standard Work defines the Current State of a process and should be created and owned by the people who do the work.
Standard work should describe the Who, What, When, Where, How and Why associated with the process.
Standard Work is a precise description of each work activity, specifying cycle time, takt time, the work sequence of specific tasks and the minimum inventory of parts needed to conduct the activity.
Standard Work is similar to Work Instructions discussed about in Documentation of the Quality System and The Product & Process Control Tools which are the detailed “How – To” instructions that describe the specific actions required to execute a process the right way.
In order for standard work to be effective, it must be actively managed, frequently discussed and constantly improved. Standard work benefits from a healthy usage of pictures and or videos.
Similarly, to maximize effectivity, standard work should always be displayed at the workplace and available to the folks doing the work.
Having standard work shortens the training cycle for new employees, and creates a standard against which improvements can be made. Standard work also reduces variation in the quality of the process, and the cycle time of the process.
Like Ohno said, having Standard Work for a process creates a foundation for improvement and consistency.
Standard work is used to both eliminate the waste of not performing a task correctly, but also ensures waste does not creep back into the process due to a lack of a documented standard.
 Tool 7: Takt Time
Another concept from the Toyota production system is that of Takt Time.
Takt Time is defined as a time element equal to the demand rate from the customer.
The word Takt is German and translates to Baton, which is used by an orchestrator conductor to provide the rhythm of the song.
Similarly, the takt time provides the rhythm or heartbeat of the production process.

Let’s do an example. Let’s say you work a single 10-hour shift every day, and after breaks/lunches, you have 8.5 available production hours each day.
Similarly, your customer demand is 4,000 units per day. What is the Takt Time?

This takt time value can be interpreted as – we must produce a single unit every 7.65 seconds to meet customer demand.
Knowing the Takt time provides a simple method for pacing production, which is how a smoothly flowing process is achieved
Takt time is often confused with cycle time.
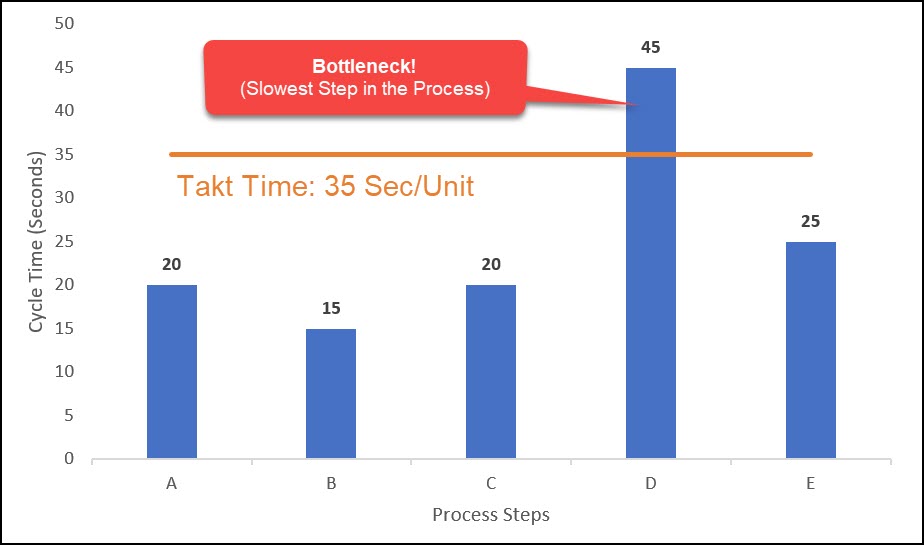
Cycle Time is the time required to complete one cycle of an operation. Cycle time and takt time are related. To keep up with production demand, the worst-case cycle time of each step in the process must be less than or equal to takt.
We discussed this in the last section within the Theory of Constraints, where we analyzed the cycle time of each step in the process against the takt time.
In this example the takt time is 35 seconds per unit, which means that a single unit must be completed every 35 seconds. Then the cycle time of each step in the process can be measured and compared against the Takt time.
To meet customer demand, your cycle time must be lower than your takt time.
Tool 8: Single Minute Exchange of Die (SMED)
One common problem that many manufacturers have, especially those who are focused on delivering only the value that the customer needs, is that oftentimes our equipment must be changed over from one product type to another.
These change-overs can be long, time consuming events, that reduce the production capacity and cause disruptions in the flow of our value stream.
To address this common problem, an industrial engineer working with Toyota Shigeo Shingo developed the SMED technique.
SMED, or single minute exchange of dies is a technique for studying and reducing the time required to change over a machine.
In the traditional manufacturing approach (not lean), most folks tend to address the problem of a long change-over by increasing the lot size and increase the run time for a given configuration.
This approach often results in the waste of over-production and inventory, and often require that you use a PUSH mentality, not a PULL mentality.
Lean practitioners take a different approach – which is to improve the change-over process.
Implementing SMED always results in a less equipment downtime (waste of waiting), and allows for an organization to remain flexible to changing customer demand.
The perfect representation of SMED is the classic Pit Stop.
- The average person can change out a tire in 15 minutes
- The average pit stop in professional racing is less than 15 seconds
via GIPHY
Next: SPC