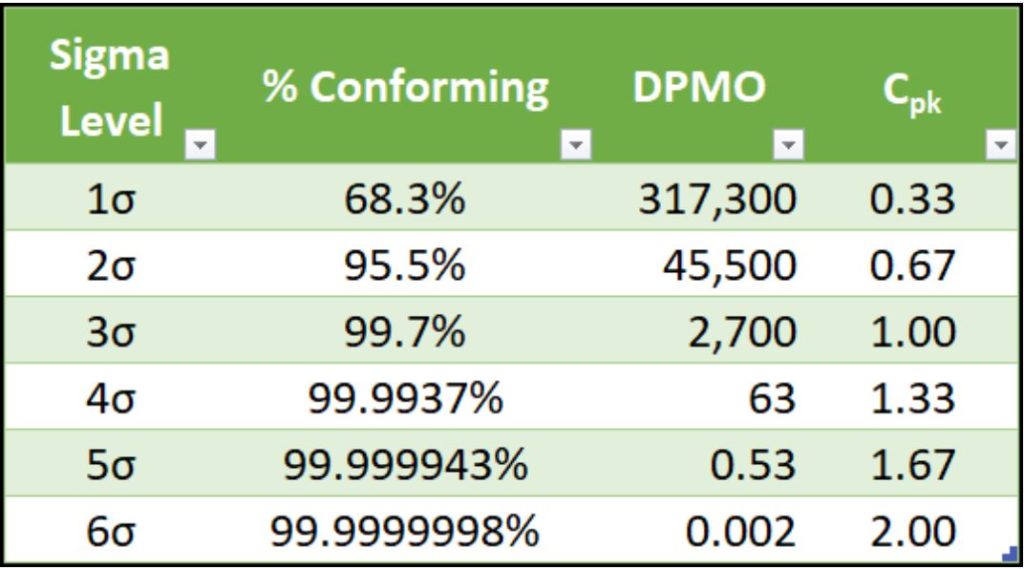
What Is Process Capability Analysis & Why It Matters
We should demonstrate that our processes are capable of repeatedly producing product that meets specifications.
The problem with this statement is that it is somewhat nebulous. How can we quantify “repeatedly”? How often do we have to build good product before a process can be confirmed as being “capable”?
To answer this question, Statisticians & Quality Professionals have developed the Process Capability Analysis Tool.
Process Capability Analysis allows us to quantify the capability of our process to produce product that meets the design specifications.
More specifically, this tool can be used to predict what portion of the overall population of product produced will fall outside of the customers specification limits – and thus result in a defect.
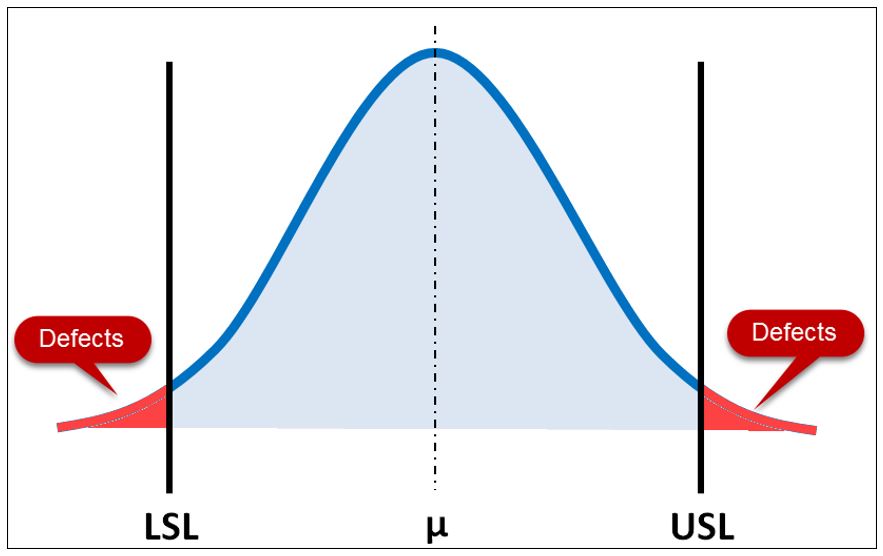
This ability to make predictions is an extremely powerful one and is the primary benefit of Process Capability Analysis.
The idea of six standard deviations (sigma) of capability was the foundation of the Six Sigma concept.
Process Specifications vs. Process Performance
Process Capability can be described as a comparison of your process performance against its process specifications using various capability indices.

Process Performance
Process Performance is the natural variability associated with your stable process. Remember a “stable” process cannot be experiencing any special cause variation; only normal cause variation.
Below I’m showing a control chart from a process that’s only experiencing natural variability and thus is “in control”. It should be understood that it is possible to have a process that is in control and also producing bad product – which is where process capability analysis comes into play.
The width of this process is considered the process performance. This process width is a reflection of the natural variation associated with the process.
A process with less variability could be described as having have higher performance and a low performance process has high variability.
Of the two processes shown below, can you spot the one with higher performance (less variability)?
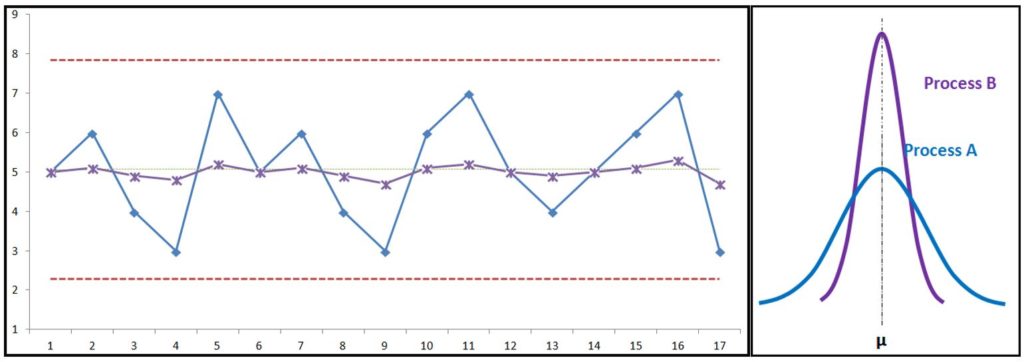
The histograms on the right represent the natural variation of each process above. Notice how Process A has more variation (spread) than Process B?
Process Specifications
Process Specifications are the pre-defined specifications associated with the product that’s produced by your process.
For example, if you’re building a widget (example below) that has critical features (highlighted), you would expect to find that critical feature on the product drawing with a dimension and tolerance. That dimension & tolerance can be considered the product specification and is usually determined by R&D or your customer directly:
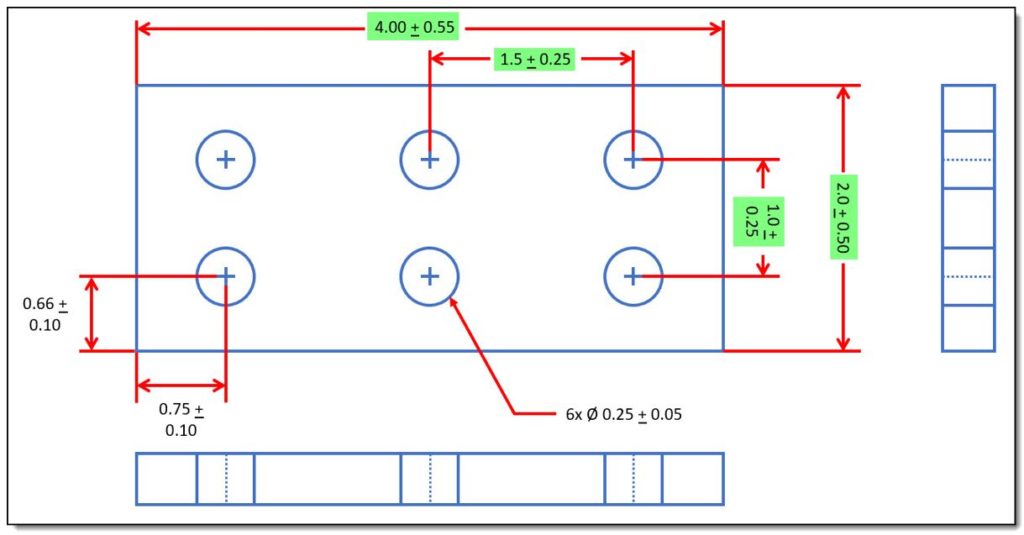
This tolerance implies that the design can tolerate that level of variability before functionality is affected. Some Quality experts like Taguchi would argue here that the moment your process if off-center from the Target/Nominal dimension, you begin to experience some amount of “quality loss”.
Within the context of this topic, the Process Specification is generally defined by the Lower Specification Limit (LSL) and the Upper Specification Limit (USL), of your product.
Process Capability
As we discussed earlier, the concept of Process Capability can be summed up in the equation below:

There are a handful of different indices that can be used to calculate process capability. These indices all represent the ability of the process to meet specifications, but have slightly different calculations.
The Cp Index
Cp is often described as a measure of the potential of the process as it represents what the process might be able to achieve if the process was centered. This is because Cp only takes variability into account and ignores the location of the central value of the process.

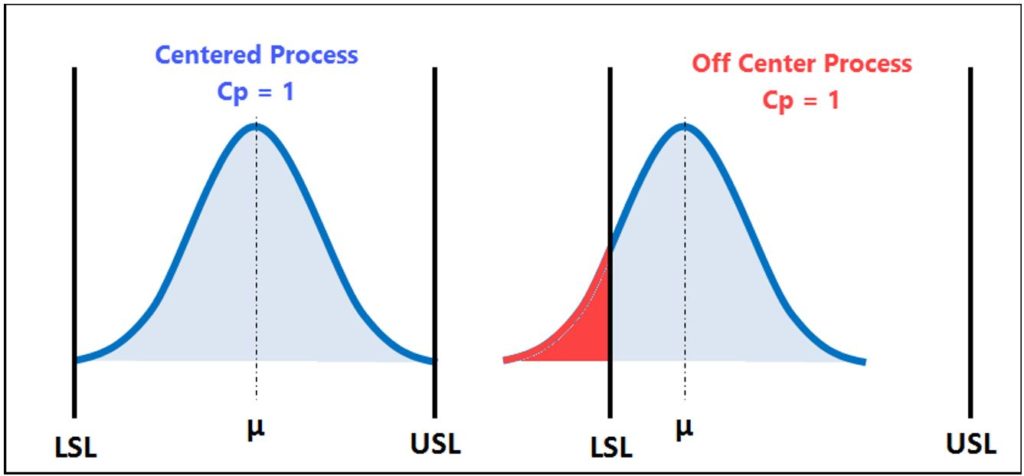
The Cpk Index
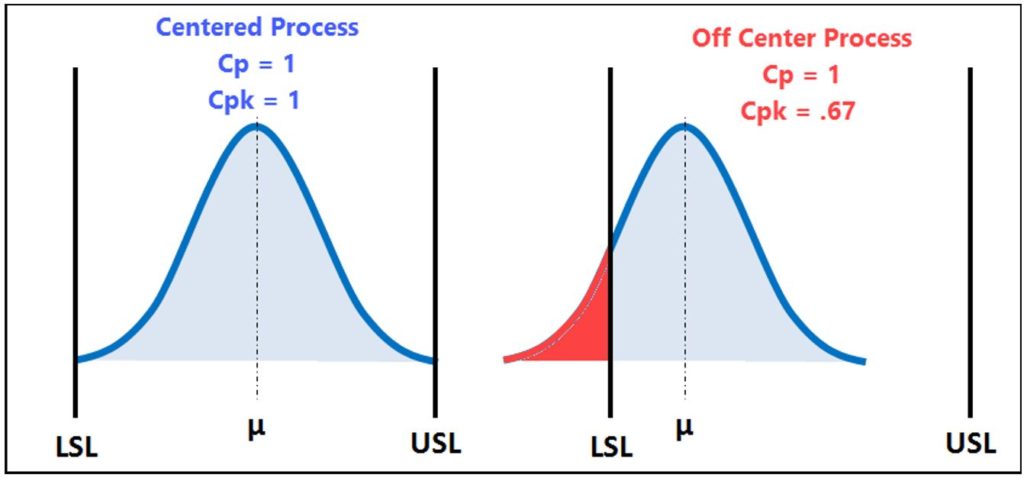
While Cp only considered the variation within your process, Cpk takes into account both the variability & and centrality of the process and therefore reflects the actual performance of the process.

To break down this equation into terms, Cpk calculates the Cp,Upper and Cp,Lower and the returns the minimum value between these two.
This index penalizes any process that is not centered, and is a more accurate reflection of the process than Cp because it takes centeredness into account.
Process Performance
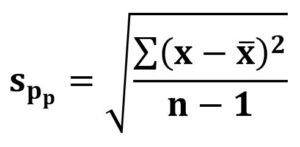
Process performance indices are calculated very similar to process capability indices. But they have one important difference, and that is how the standard deviation is calculated. Process capability indices generally get their standard deviation from a control chart that only considers within-lot variation. However, process performance indices use a different standard deviation calculation that also takes into consideration the between-lot variation:
The Pp Index
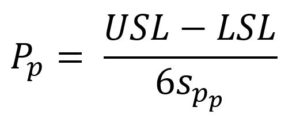
Pp is like Cp in that it only assesses the variability of your process & assumes the process is centered. It does not take the centrality of your process into account.
Similarly, if the process is not centered, then Pp becomes less representative of your actual performance and becomes more representative of the “Potential” of the process if it were centered.
The Ppk Index
As we discussed above, Ppk is calculated much like Cpk in that it considers both the central tendency of your process & the variability.
It’s primary difference, as described above, is the way the standard deviation is calculated, which is why Ppk is often described as a more conservative estimate of long-term performance.
How To Interpret Your results
Your Process Capability Requirements (minimum acceptance criteria) should be risk based. Process Capability Analysis results can be inputs into an FMEA or a Risk Assessment, using the table as the “likelihood of failure” portion of your Risk Analysis.
